Introduction to CSVGPT
CSVGPT is a GPT4 based data analysis tool that allows users to upload CSV files and analyze them using natural language. CSVGPT has integrated with platforms such as GitHub, Canva, Replit, and Jupyter, which simplifies the data analysis process.
How to Use CSVGPT
After entering the homepage of CSVGPT, click Try Now to go to the page for uploading files and sending prompts.

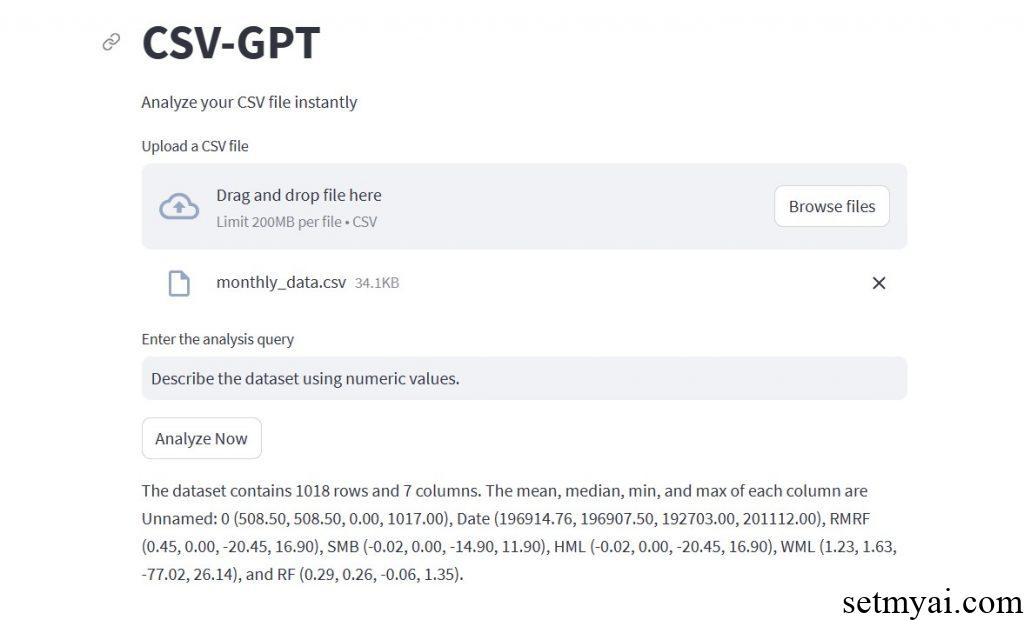
We uploaded a CSV file about the Fama French three factor models, which contains monthly market excess return RMRF, three factors (SMB, HML and SML), and Risk-free rate RF.
First, let CSVGPT describe the data (Describe the dataset using numerical values). CSVGPT outputs the number of data, as well as the average, median, minimum, and maximum values for each column.
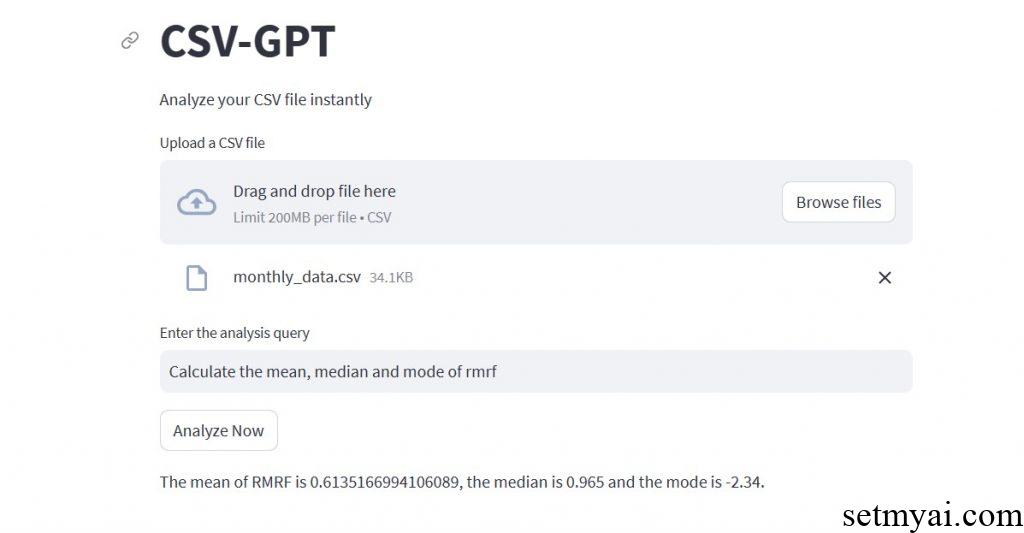
Subsequently, we used CSVGPT to describe the average, median, and mode of market excess return RMRF (Calculate the mean, medium, and mode of rmrf). CSVGPT sequentially outputs these three results.
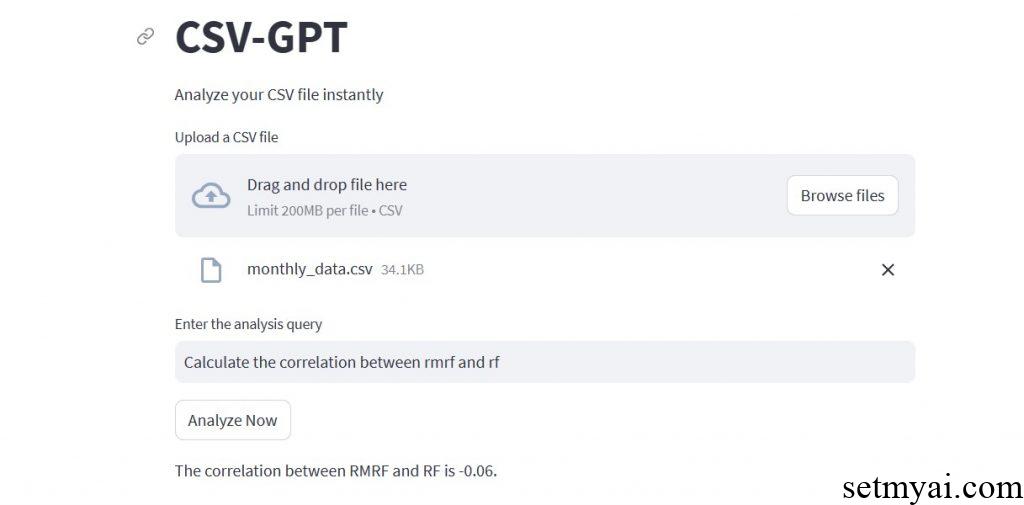
Finally, we calculate the correlation between RMRF and Risk-free rate RF (Calculate the correlation between rmrf and rf). The results calculated by CSVGPT are the same as those calculated in Excel.
Summary
As a data analysis tool based on artificial intelligence, CSVGPT is very simple to use and can obtain accurate calculation results. The maximum limit for CSV files is 200MB, which can meet most needs for users.
Website: